CubeSolver - Computer Vision
Detecting the colors of our cube allows the robot to solve a cube autonomously. The detection process consists of several steps:
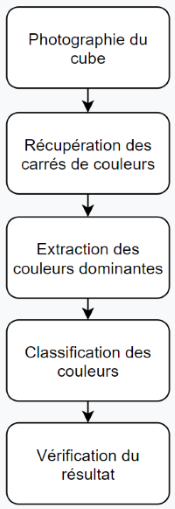
Each step of this process is detailed in this article.
Photographing the Cube and Retrieving Color Squares
The images taken by the camera are retrieved and manipulated using OpenCV (here).
In the case of the OTVINTA robot, two photos will be taken for each face, since the robot always holds the cube with two hands, thus hiding two colors each time.
For each photo we take, we will extract the areas of the image corresponding to the cube's stickers. The objective will now be to interpret these 54 color squares. Here is an example of extracted data on a cube:
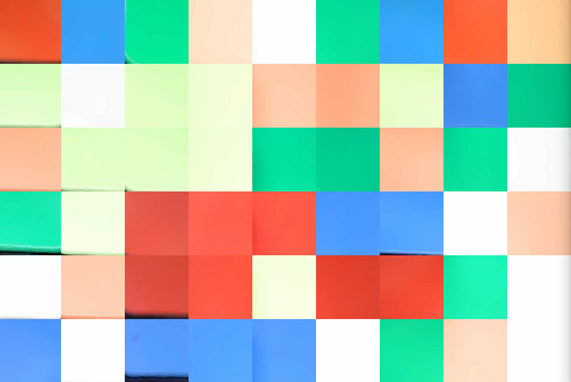
In this image, each line corresponds to a face of the Rubik's Cube, and we can see that some black areas have sometimes been included (this is the black plastic constituting the cube). This information is usable, as a human would be able to reconstruct the cube without much difficulty. (A clear distinction can be made between the colors).
Extracting Dominant Colors
A first step in interpreting these images is to extract the dominant color from each of these color squares. For this, we use a K-Means Clustering algorithm, before retrieving the color corresponding to the largest cluster.
Here is the result when applying this procedure to the same data:
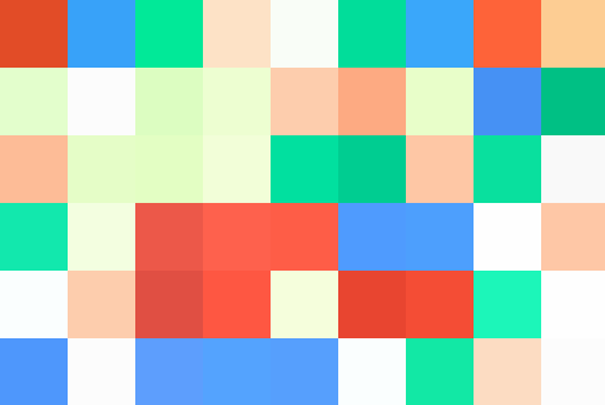
The result is satisfactory: the colors correspond well to the previous image and can subsequently be used for classification.
Color Classification
Classification Method #1 - Nearest Center
This is a simple classification method. It exploits an advantage we have regarding the context: we already know the color of the center of each face (since these centers are immobile on a Rubik's cube). The center of the WHITE face is WHITE, the center of the ORANGE face is ORANGE, etc.
On this visual, the centers are in the fourth column:
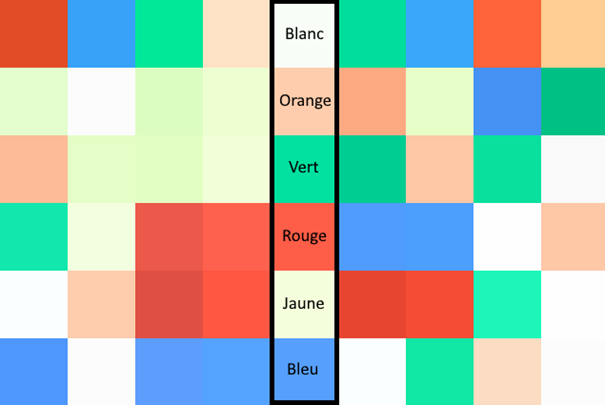
To classify the color squares of this image, we can therefore ask ourselves, for each one, "which center's color is it closest to?"
To examine the degree of similarity between two colors, it is very convenient to consider them in LAB format. The LAB format describes the appearance of a color for human eyes. It has three components:
- The luminosity (L) between 0 and 100.
- The a component (green-red axis), between -128 and 127.
- The b component (blue-yellow axis), between -128 and 127.
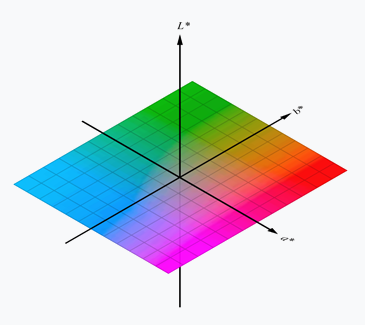
In this format, it is possible to evaluate the similarity between two colors using Euclidean geometry (the distance between two points). Thus, we can associate each dominant color with the color of the nearest center, and complete our classification.
Classification Method #2 - Neural Network
To classify our colors, it is possible to use a neural network. We will examine each of our colors independently, possibly with a parameter representing lighting conditions. Indeed, lighting conditions can greatly change the appearance of a color. You can easily confuse yellow / white, or red / orange.
Creating a Dataset
A neural network bases itself on previously acquired experience to classify new elements. To represent this experience, we will record the colors we perceive with our camera. We can then use these recordings to create a model suited to our problem.
To make these recordings, we can have the robot repeatedly photograph each face of a solved cube. The dominant colors are then recorded in CSV files.
Analyzing the Recorded Data
After making some recordings under different lighting conditions, it can be interesting to visualize our data, to better understand the problem. The following graph presents 12,000 recordings in a LAB format graph:
Well, this is an interesting graph! By observing it, we can understand the difficulties we may encounter:
- Red and orange overlap. The same color can be red or orange, depending on lighting conditions.
- The white value also varies greatly. It can easily be confused with other colors (mainly yellow).
- The more a color is luminous, the less it is saturated. (Except for green, which does not approach (a = 0, b = 0) as luminosity increases)
But still, the data is well grouped. Classification should therefore be possible.
To successfully differentiate red and orange, we can add new information to our recordings. For this to be effective, this data must be representative of the lighting conditions. One idea is to use the value recorded for white during each recording. (Each photo series begins with a photo of the white face, whose center is always white). Our recordings therefore include six values: the first three correspond to the white value recorded on the first face, and the last three correspond to the color we are trying to classify.
Creating a Classification Model
Now that we have all the data we need and we have analyzed it, it's time to build a classification model!
To do this, we will use TensorFlow and Python (creating such a model is much simpler in Python than in Kotlin). The data is extracted from the different CSV files, then the dataset is split into a training dataset and a validation dataset.
A Keras model is created using TensorFlow; its architecture is as follows:
- An input of 6 values (LAB of the color we are trying to classify, LAB of the white color)
- Intermediate layer of 64 neurons
- Intermediate layer of 32 neurons
- Intermediate layer of 32 neurons
- Intermediate layer of 32 neurons
- The network output: 6 activations corresponding to the estimated probability of belonging to a category
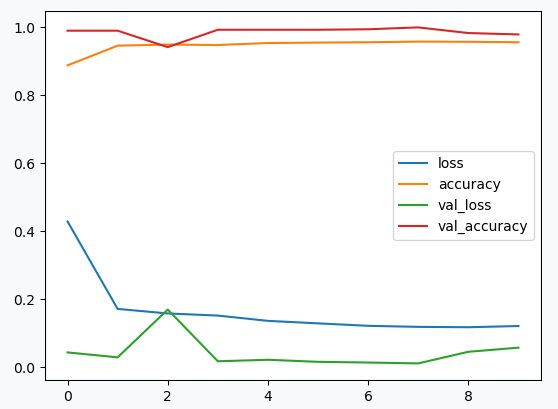
We have an accuracy close to 99% on the validation dataset, which is satisfactory. This model seems to generalize well (no overfitting) and we can therefore expect good results. The trained model is saved, and it will now be possible to use it from the Kotlin code.
Using the Keras Model from Kotlin
It is possible to import a Keras model from Kotlin code using the Deeplearning4j library. Once the model is imported, all that remains is to query it with the different colors we need to classify: the activation values of the output nodes will tell us the probability of belonging to a category.
Verification of the Result
Now that we have:
- Photographed the cube
- Retrieved the color squares
- Extracted the dominant color of these squares
- Classified these colors
We need to verify that the obtained data is consistent (there may be classification errors). To do this, we will initialize a cube with the colors we obtained, and check if this cube is valid (we will "verify the integrity" of the cube).
A Rubik's Cube must obligatorily satisfy all of the following conditions:
- There are nine squares of each color.
- Each piece exists, and exists only once.
- The number of correctly oriented edges is even.
- The sum of the corner orientation values is a multiple of three.
- The parity of the number of edge permutations needed to solve the edges is equal to the parity of the number of corner permutations needed to solve the corners.
If these conditions are validated, our cube initialization is complete, and we can begin a solve! The cube is necessarily solvable.
Areas for Improvement
It is of course possible to add other classification methods, but for the moment, the biggest problem in terms of user experience is that if we do not arrive at a valid cube at the end of the process, we have to start over and take new photos. To avoid this, we could examine the result of the detection and determine the most likely cause of the failure.
1. Finding Classification Errors
If a single color was incorrectly detected, it should be possible to find which one. Indeed, if we detected 8 red squares and 10 orange squares, it very probably means that one of the orange squares was actually red. By examining the list of cube pieces from our color detection, we can present the user with a hypothesis about the most likely cube state.
2. Verifying if the Detection Matches an Invalid Cube
If you disassemble a Rubik's Cube and randomly reassemble it, it may not be solvable. If this is the case, the cube will not pass the integrity verification, even if the colors were correctly detected. We can present the user with a hypothesis about the cube's state, and if it is valid, inform them about the steps to correct the problem.
3. Examining Lighting Conditions
It can happen that reflections prevent seeing the color squares on the images, or that the image is too dark. This can be detected by examining the average luminosities of the colors, and observing that there are many classification errors. In which case, we could indicate this to the user and invite them to adjust the lighting conditions.